Share this
How to Use Different Indicators on TradingView
TradingView is a platform for technical chart analysis that provides over 100 types of tools and indicators for analysis. However, for beginner investors, basic indicators can be selected to help make investment decisions easily. Indicators can generally be divided into three categories:
Fixed Formula Indicators
These indicators have a preset calculation formula that cannot be altered and are designed to analyze price trends in various ways. Typically, three types are commonly used:
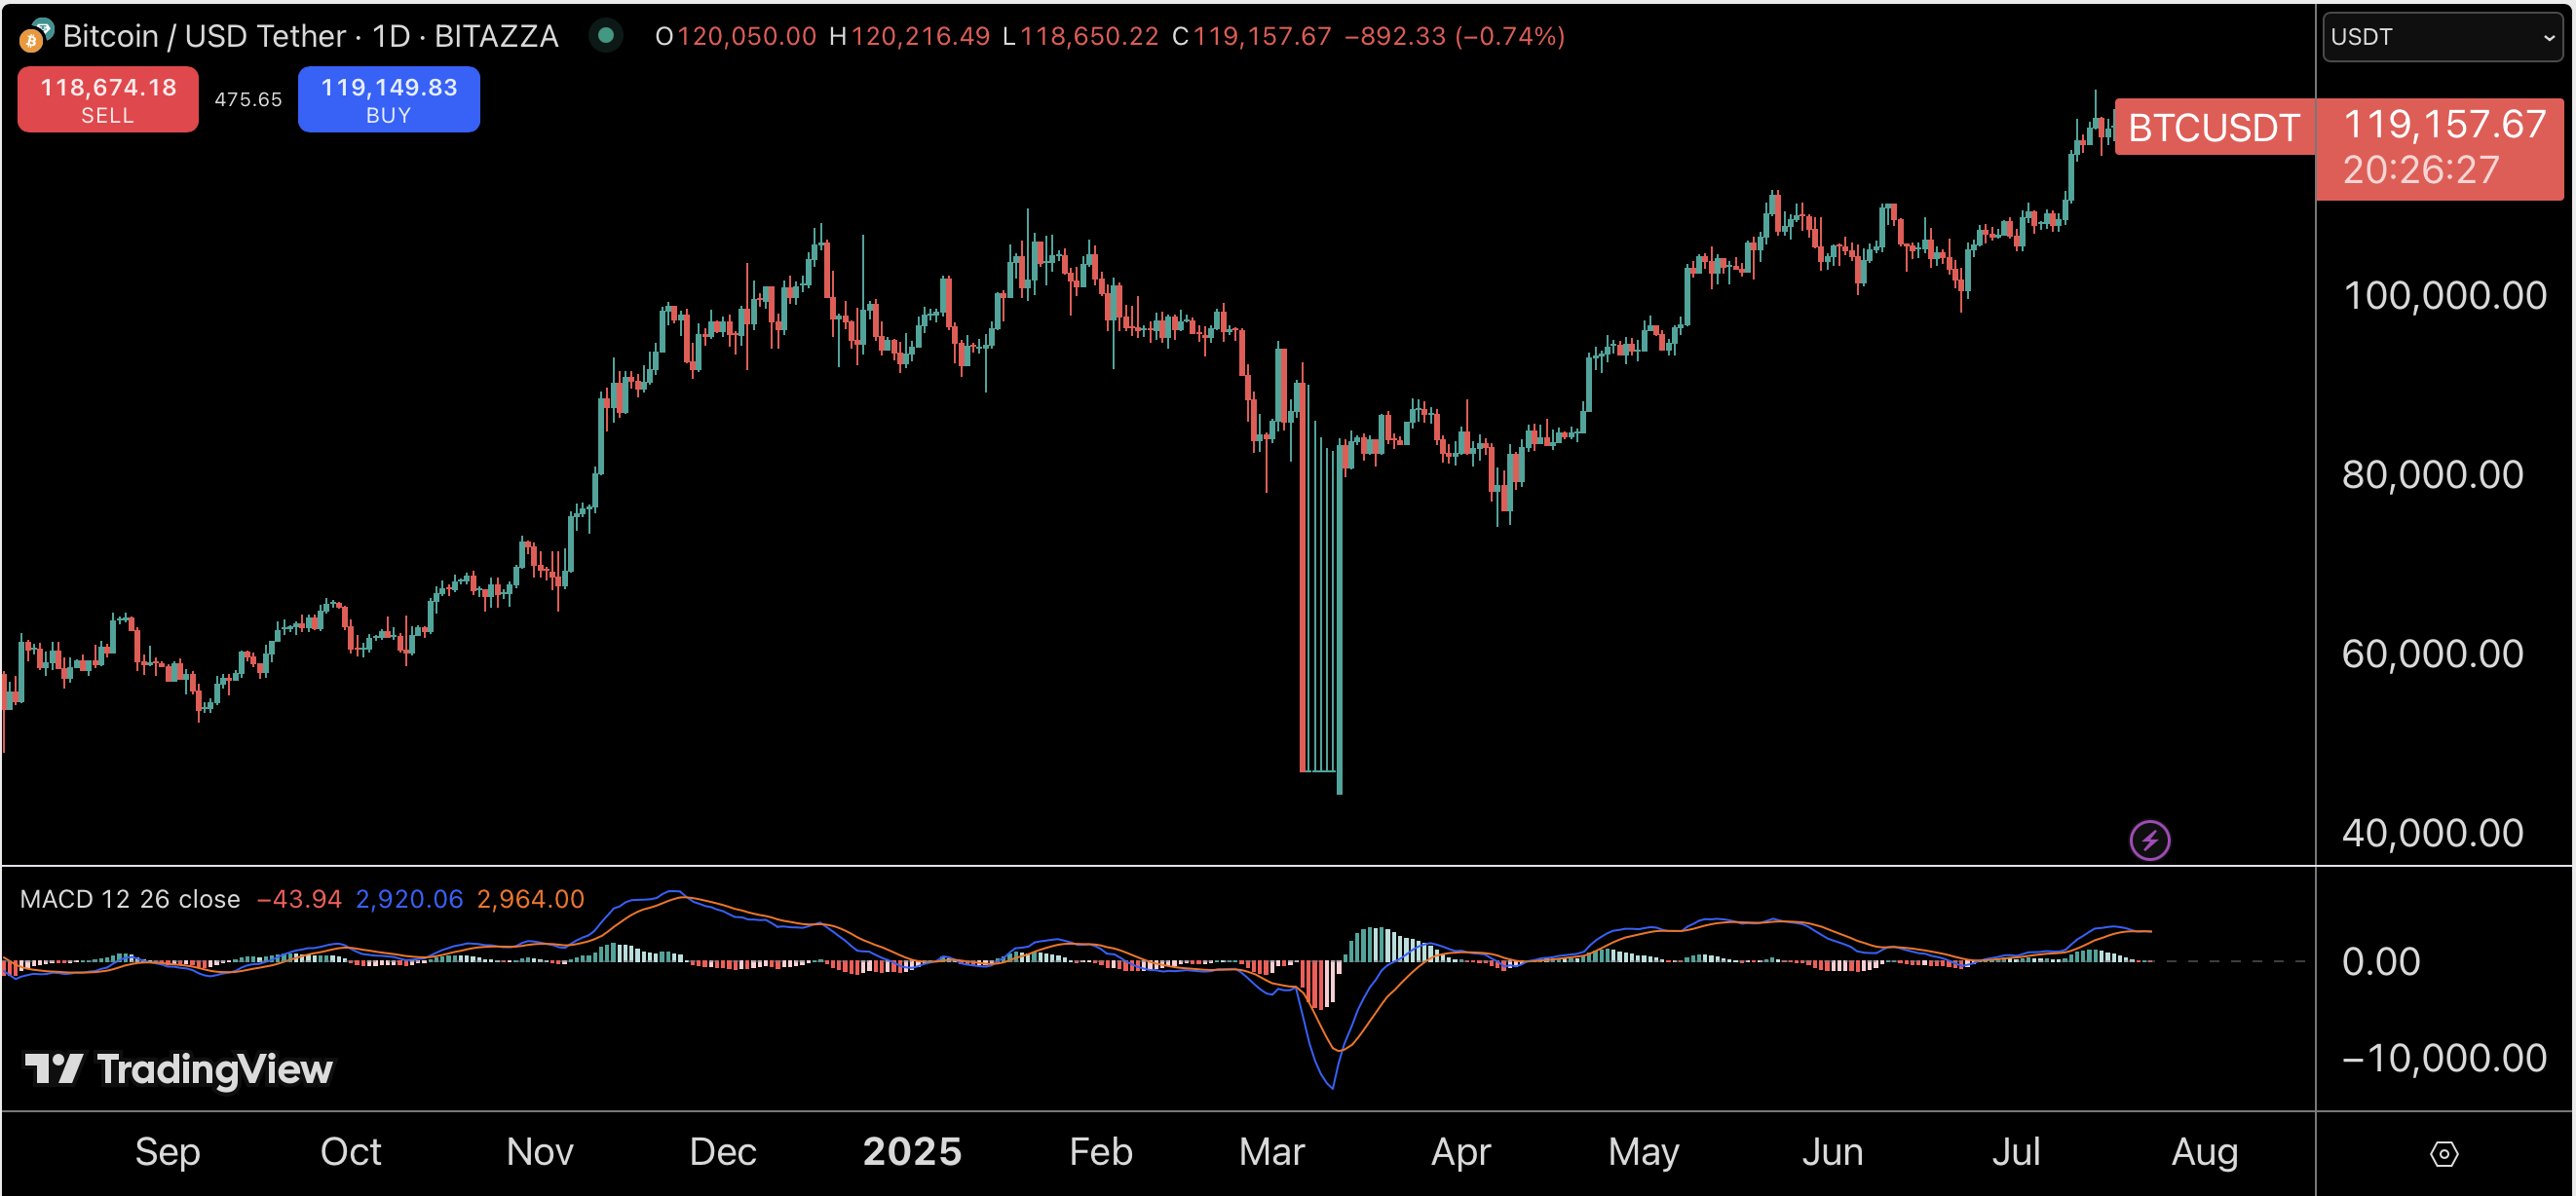
- MACD (Moving Average Convergence Divergence): This tool measures long-term price trends, indicating whether the market is in an uptrend or downtrend. If the MACD is above 0, it signals an uptrend, while below 0 indicates a downtrend.
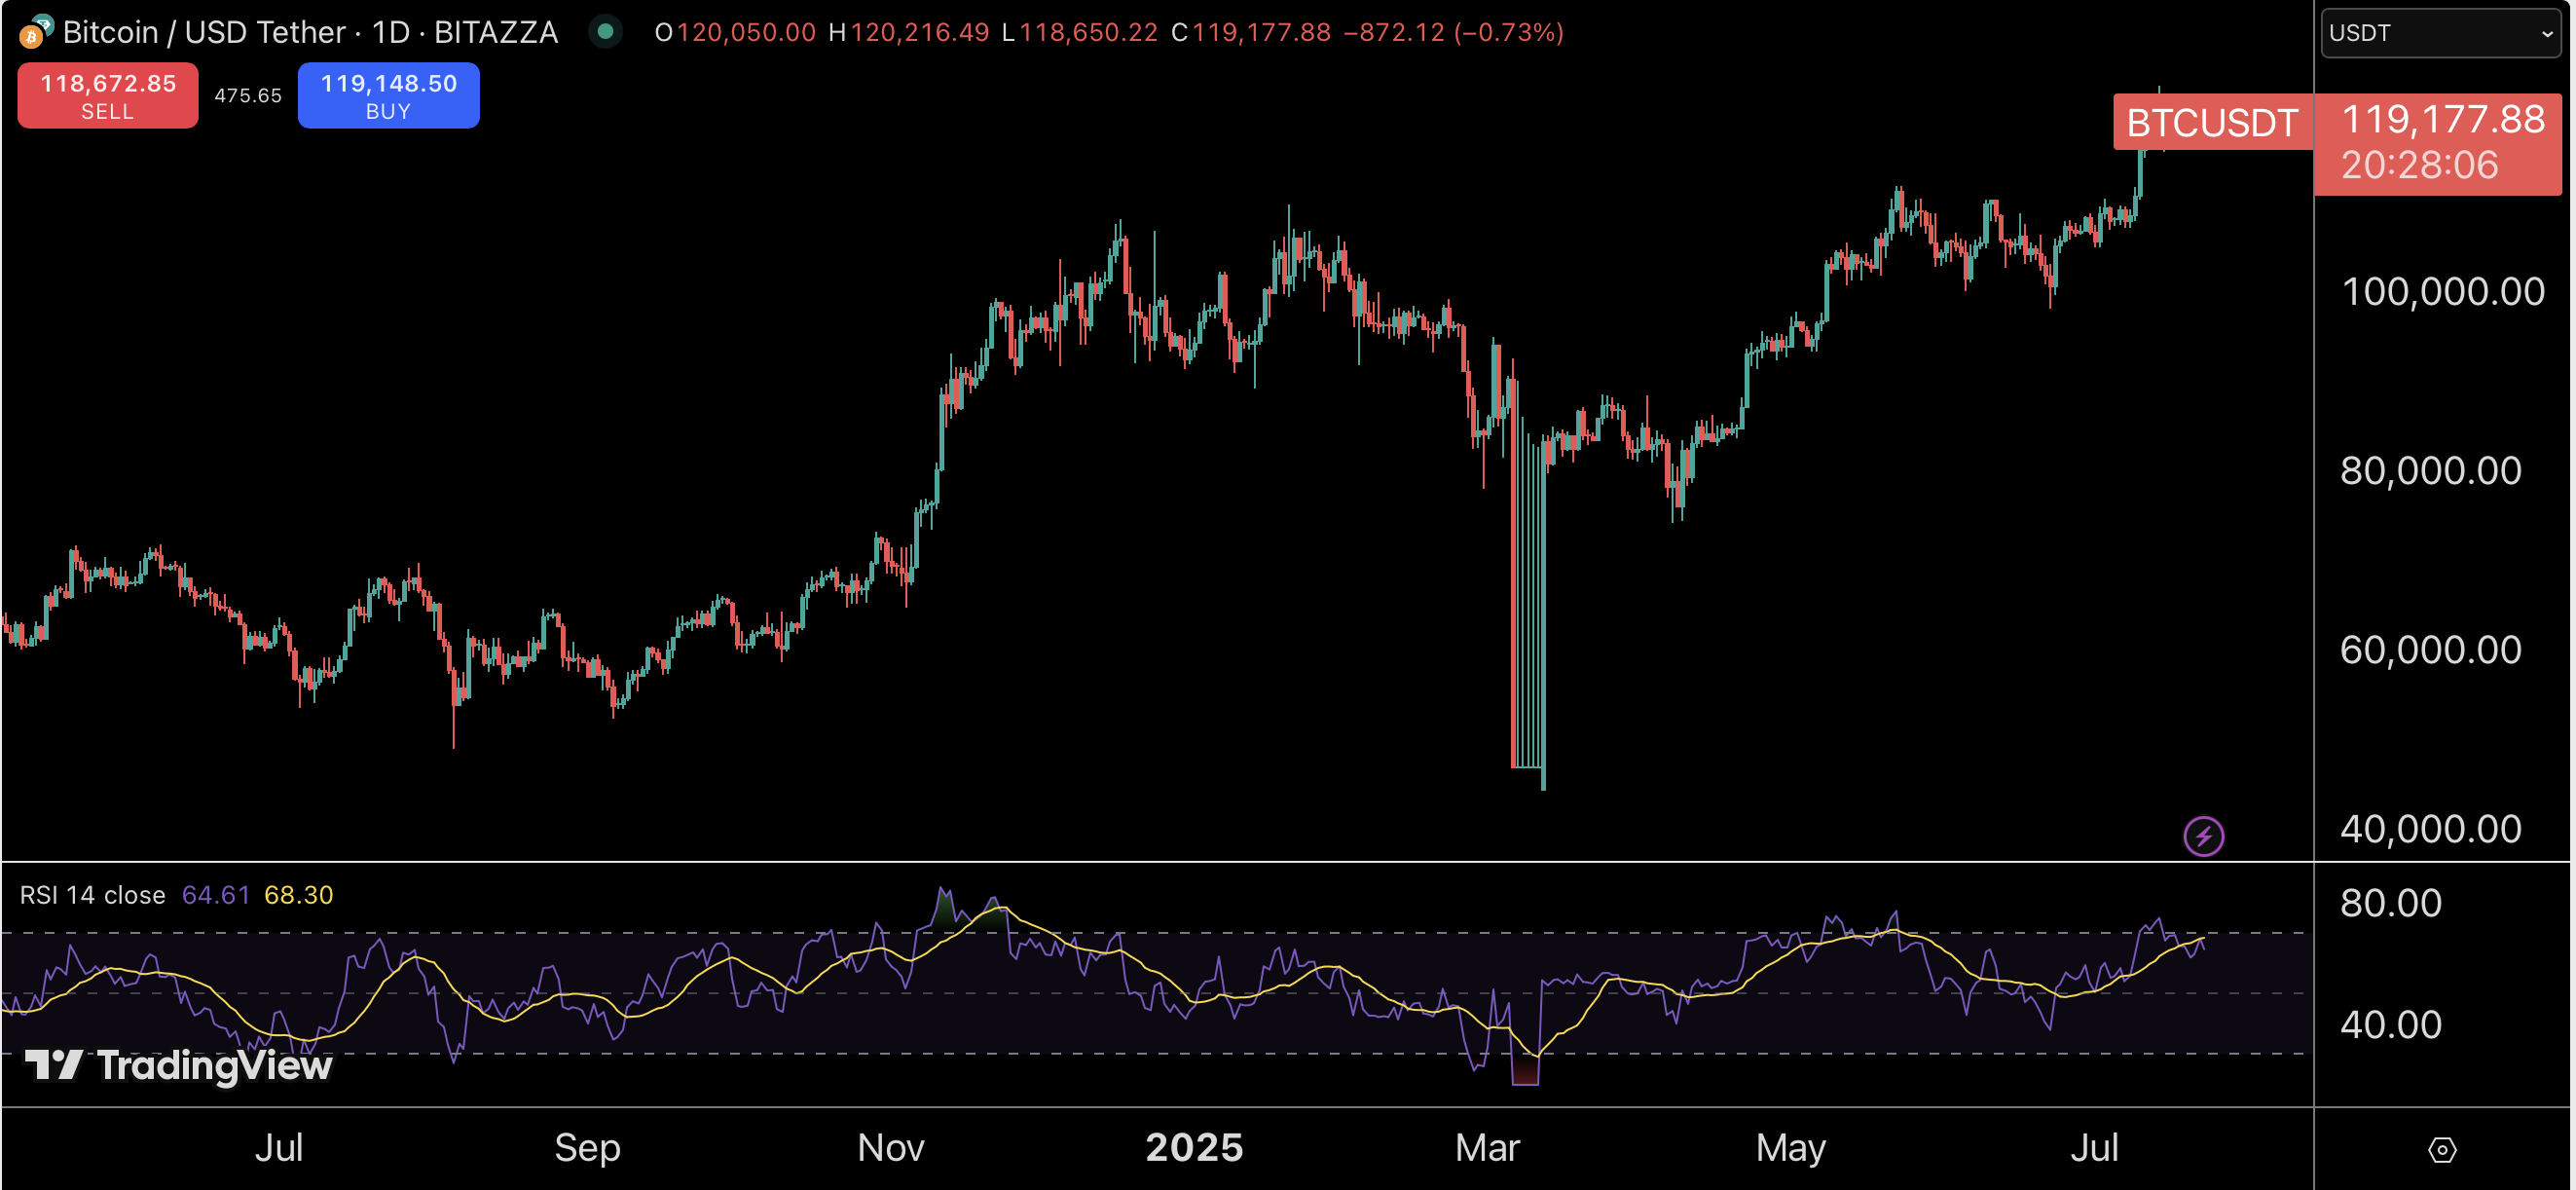
- RSI (Relative Strength Index): This tool measures price momentum to determine whether an asset is overbought or oversold. If the RSI falls to 30, it indicates the asset is oversold, suggesting a potential price rebound. Conversely, if the RSI reaches 70, it suggests the asset is overbought, which may lead to profit-taking. Traders can base their buy/sell decisions on the fixed RSI formula.
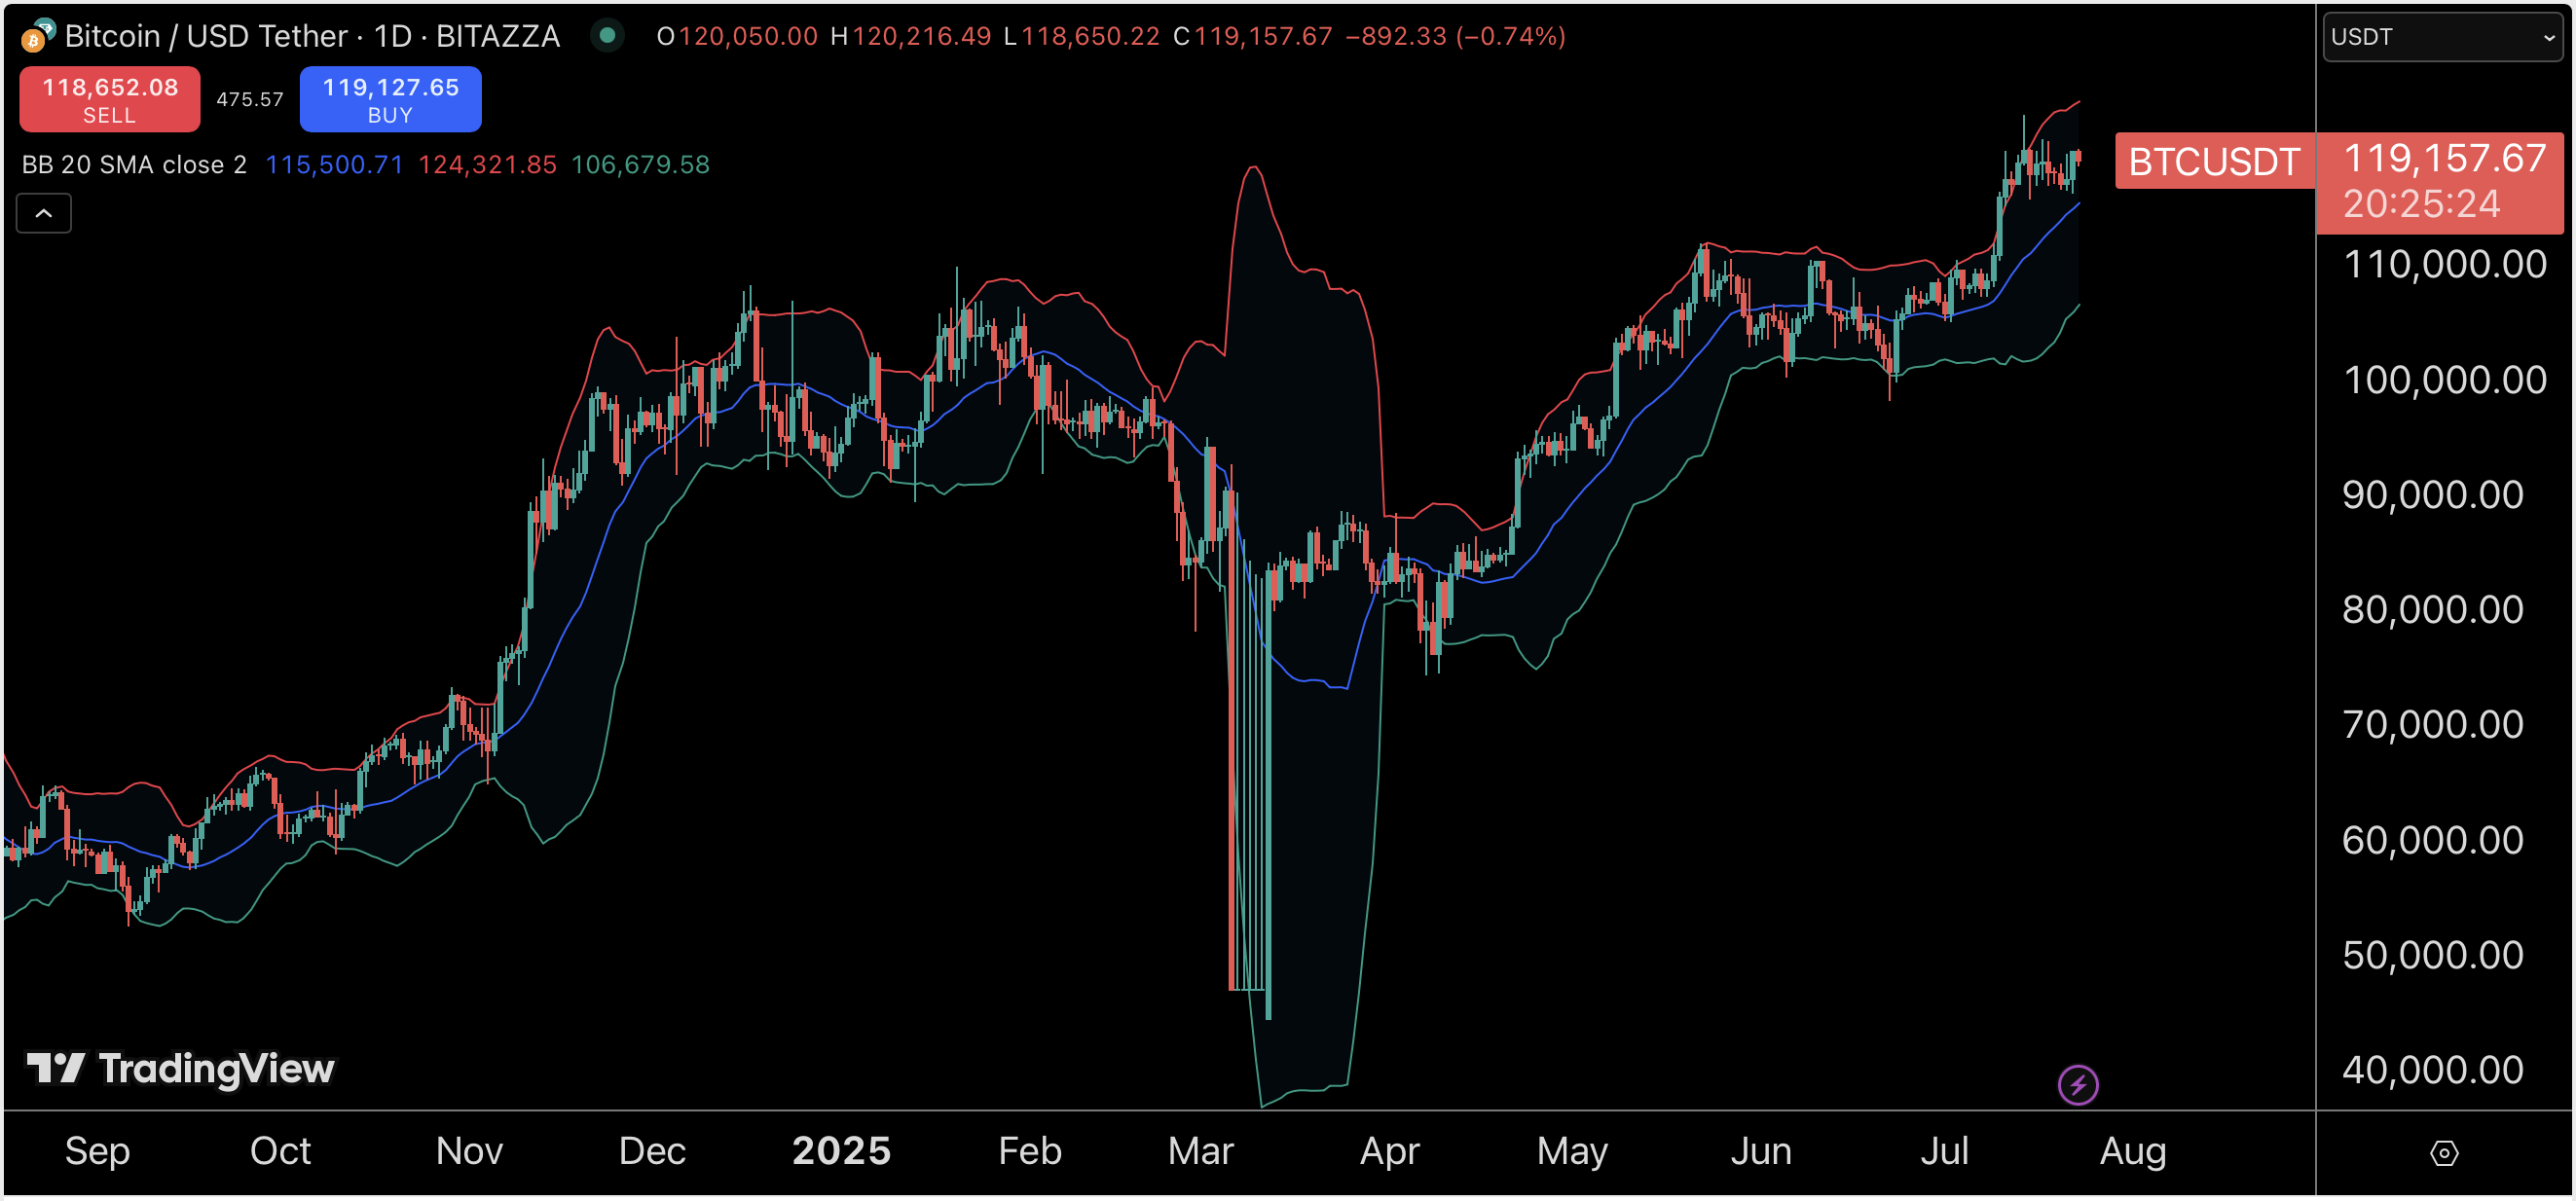
- Bollinger Bands: This tool measures support and resistance levels when the price is moving sideways. It is built on a pre-established formula that cannot be modified. The calculation displays support and resistance levels, helping investors make buy/sell decisions based on the derived price levels.
Customizable Formula Indicators
These indicators come with a fixed formula, but investors can adjust parameters based on their preferences and experience.
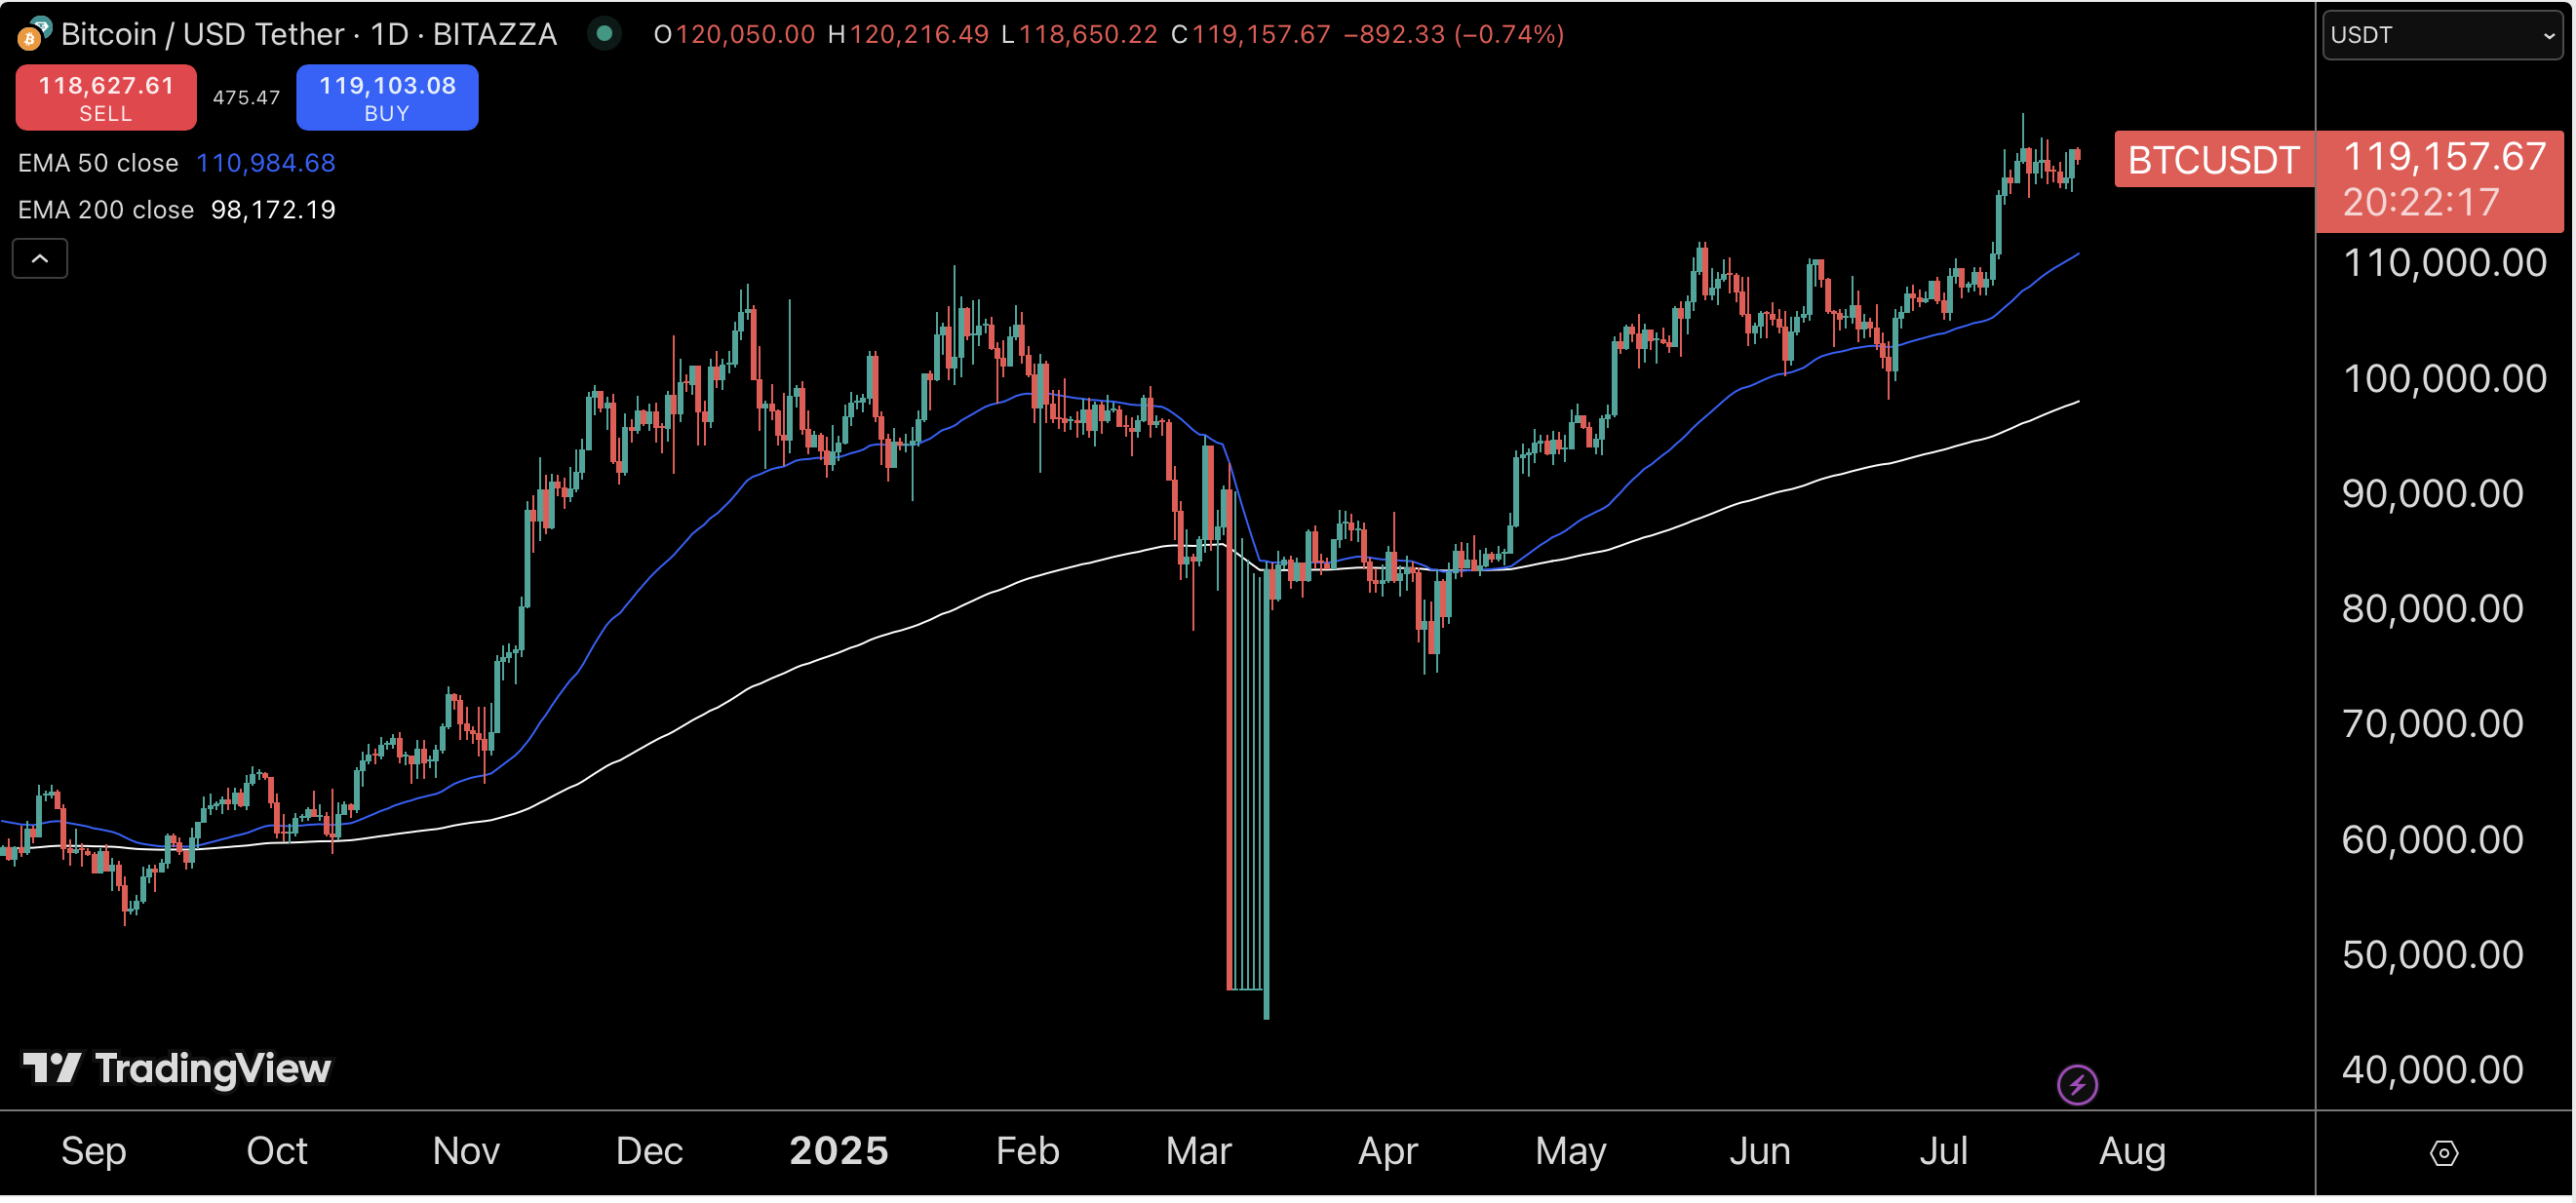
- MA (Moving Average) and EMA (Exponential Moving Average): These tools calculate the average price over a selected time period, helping investors identify the average cost. For example, MA50 refers to the average price over the past 50 days. If Bitcoin's MA50 is $20,000, it suggests that the average investment cost over the past 50 days is at that level. This can be used as a buying point if the price retraces to that level.
Investors can customize the values in MA and EMA based on their trading style. For example, some prefer MA50, while others may favor MA35.
Specialized Formula Indicators
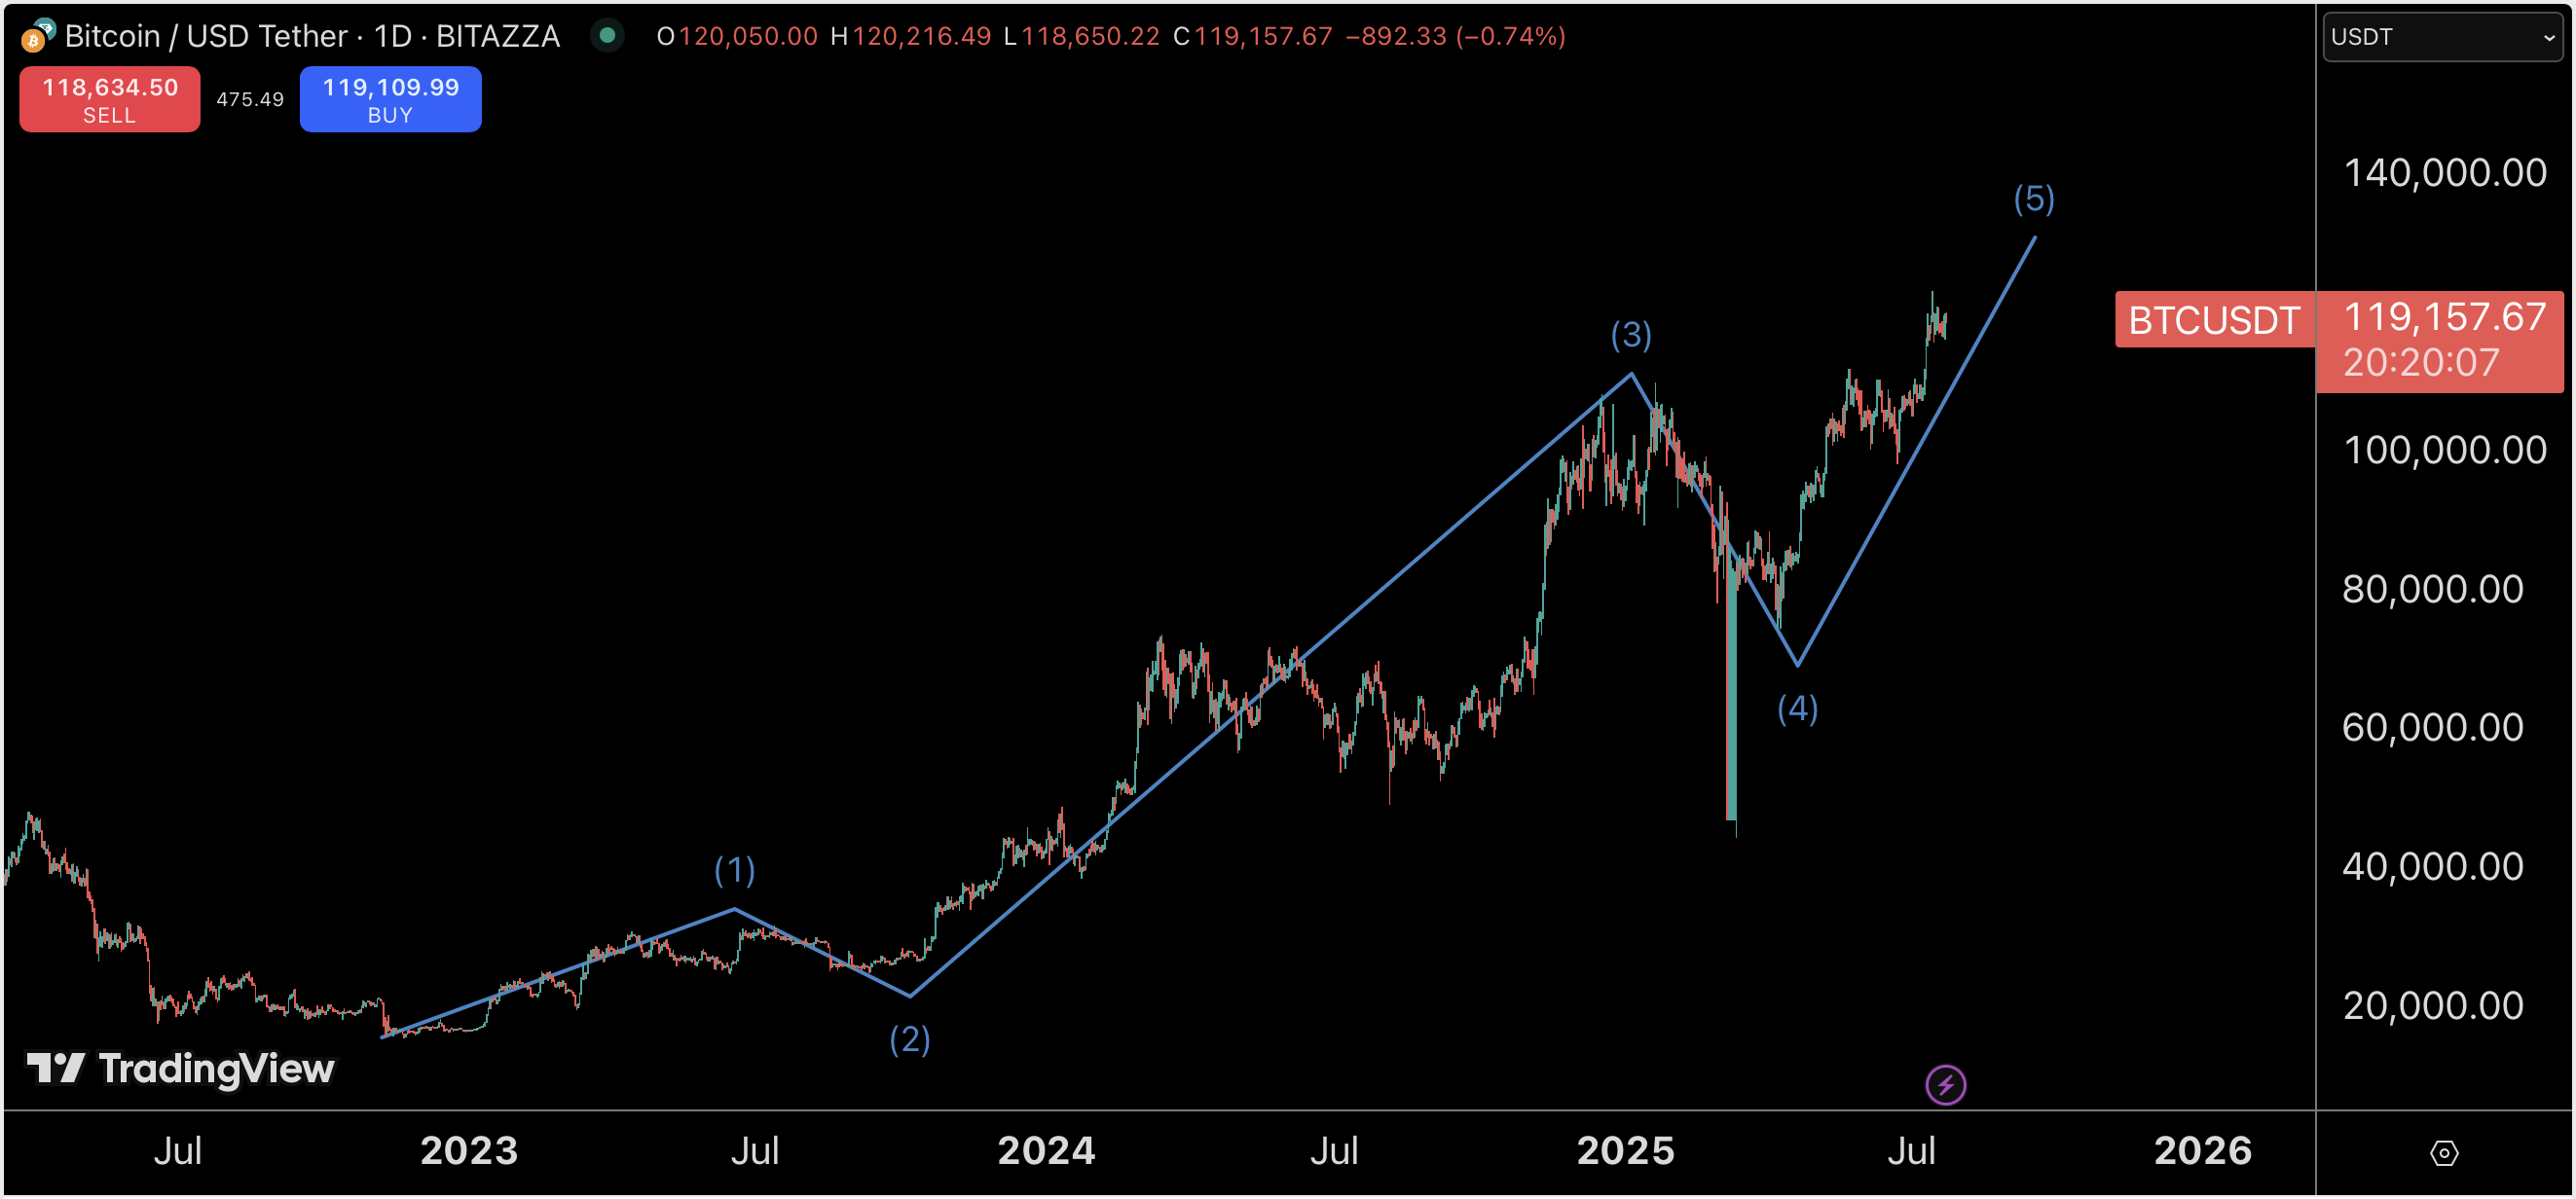
These are ready-made indicators that have been developed and tested over time and are widely accepted. Investors can use them but must have a solid understanding of the specific indicators. An example is the Elliot Wave, which is used to analyze price movement trends. TradingView offers many of these tools, allowing investors to select based on personal preferences.
Before choosing an indicator that suits your skills and approach, investors should have prior experience in trading to determine which tools work best for them. It’s recommended to use only the necessary indicators, as using too many can lead to confusion.
Connect Bitazza withTradingView now!
Share this
- February 2026 (1)
- January 2026 (4)
- December 2025 (13)
- November 2025 (6)
- October 2025 (10)
- September 2025 (8)
- August 2025 (17)
- July 2025 (29)
- June 2025 (13)
- May 2025 (14)
- April 2025 (12)
- March 2025 (8)
- February 2025 (8)
- January 2025 (8)
- December 2024 (7)
- November 2024 (5)
- October 2024 (14)
- September 2024 (9)
- August 2024 (14)
- July 2024 (3)
- June 2024 (48)
No Comments Yet
Let us know what you think